
How Much Should I Be Able To Lift (And Still Respect Myself In the Morning)?
This article is written from the perspective of an older guy new to the Olympic lifts.
Once the decision is made to learn the lifts, some of the first questions that occur to the new athlete are, “How much should I be able to lift?” and “If I can snatch X, how much should I be able to clean & kerk?” and finally, “As a lifter no longer in my prime, how will I perform as I age?”
Additionally, one lifter may be larger or smaller than another. This is reflected in the separation by weight class. Furthermore, to split hairs, the weight classes are different between males and females. How does sex (the phenotype guys, not the act) affect the amount of weight we can lift?
These questions are not new and they’ve been treated elsewhere in the scientific literature. However, a “trust but verify” philosophy, using real data from real lifters in real competitions, might augment the knowledge base.
The data used for this article spans 10 years of competitions between 2001 and 2011, including the National Masters, Pan American Masters, World Masters and American Masters competitions. The purpose is tailored to the older, less experienced athlete. It includes over 8,000 event entries from over 3,870 lifters, including approximately 3,300 men and 570 women. The method largely applies linear regression analyses.
Before we dive into the details, a few definitions of statistical terms are in order. We’ll just deal with the basics:
Average: The average of a population or sample is defined as the sum of all measurements in the population or sample divided by the number of measurements. As a formula:

Median: The numerical value separating the higher half of a sample, a population, or a probability distribution, from the lower half… i.e., the “middle of the pack” value.
Percentile: the value of a variable below which a certain percent of all observations fall. For example, the 25th percentile is the value below which 25 percent of the all observations are found.
Now, let’s take the questions one at a time:
1. How much mass, in kilograms, should a Master’s Division Olympic weightlifting competitor be able to lift when performing the snatch and the clean & jerk?
Considering all participants, male and female, of all ages and weight classes that totaled, the overall average lift for the Snatch is 74kg while the overall average for the Clean & Jerk is 94kg.
Since the data is heavily weighted toward male participants by factor of about six (3,300 males vs. 570 females), intuitively one would deduce that the values represent men better than women. In fact they do, so we’ll differentiate between the sexes later.
But first, let’s consider the relationship between the Clean & Jerk and Snatch. In other words:
2. If a Master’s Division Weightlifter can snatch X, how much should he/she be able to Clean & Jerk?
By taking a simple ratio of the averages from the first question, we can see that
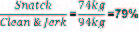
This ratio seems to be pretty consistent across most of the variables for which we are concerned. For most lifters no matter their age, or weight class this ratio doesn’t change too much, maybe a few percent one way or the other. But there is a slightly lower bias (two to three percent) toward our female competitors.
To illustrate this point, table 1 shows the average, median, 25th percentile and the 75th percentile values for the Snatch and Clean & Jerk as a function of sex.
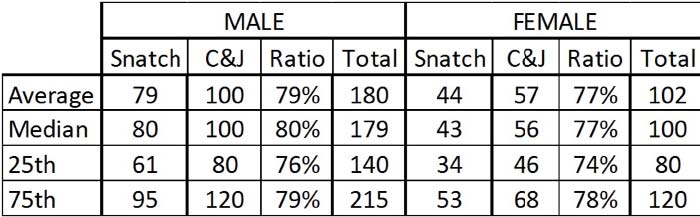
Table 1
So for men, if you want to know a normal snatch weight, simply multiply your clean & jerk by 0.79, or conversely, if you want to know the normal clean & jerk, simply divide your snatch by 0.79. Women could use the same or slightly lower value of 0.77.
It should be noted that this relationship is not cast in stone. We are all individuals with different body types and abilities. However, deviations from this norm may point to deficiencies or weakness in the form or physiology of the lifter. An experienced coach may use this to his or her advantage, although, I imagine that a good coach wouldn’t need fancy math to assess an issue they could instantaneously figure out based on experiential knowledge.
The chart below shows the maximum clean & jerk values as a function of maximum snatch. The relationship for both men and women is very linear. The R2 values of over 0.9 indicate that this very tight relationship. In fact, we can say with 96 percent confidence that we can predict one variable knowing the other.
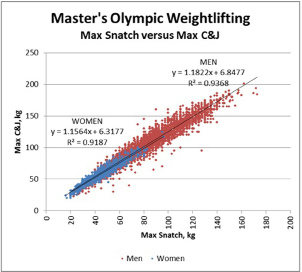
This relationship is also confirmed by the likes of Bob Takano ; who puts the relationship between 78 percent and 82 percent. It is also confirmed by others in various forums on the internet.
3. What about sex?
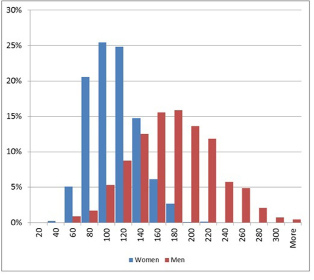
When it comes to the physics of lifting a heavy mass over our heads women are the weaker sex. There’s just no way around it. This certainly is not meant to be sexist, derogatory or mean-spirited in any sense. It’s just what the data says. The chart below is the distribution of total lift scores for men (red) and women (blue). In conjunction with the data from table 1, it can be seen that, on average, men can lift about twice as much mass as women.
This is not to say that some women can’t lift more than their male counterparts. That’s demonstrated by the overlap between the blue and red bars in the chart. As a matter of humility, the author would personally be an excellent female Masters competitor.
4. Body Mass?
Even newcomers to the sport learn quickly that as the mass of a weightlifter increases, so goes the maximal lifts attained. The next two charts are pretty busy, but they contain a wealth of information that should be useful to the average new guy/master’s level competitor.
These charts show the relationship between the body mass of males (red) and females (blue) and the snatch and clean & jerk, respectively. A note of caution: the data is somewhat confounded as it includes all age groups. More about age next.
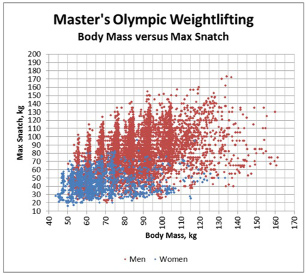
Nevertheless, a lifter can gain insight relative to lifting potential by simply finding their body mass on the X-axes (horizontal) and looking up along the Y-axes (vertical) and seeing where the values intersect.
For instance, a male lifter weighing in at around 70kg can see that for the snatch, the data spans from a low of about 25 kg to a high of 124 kg. The middle of pack for this lifter is around 75kg. Similarly, the same lifter could expect to range between 35 and 150kg for their clean & jerk, with the middle of the pack being around 95kg. Just for fun, as a sanity check we can take the snatch/c&j ratio of 75kg/95kg = 78.9 percent and see that our ratio is consistent from above.
5. Age?
The final factor we’ll consider affecting the maximal lifts is our age. There’s no stopping time, so let’s march along with it and take what we can.
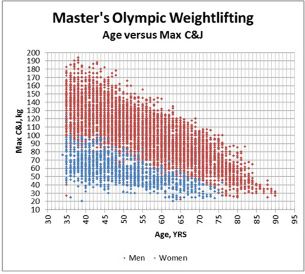
The next two graphs show the max snatch and max clean & jerk attempts for all competitors that totaled. They show the relationship between males (red) and females (blue) as a function of age in years for the snatch and clean & jerk, respectively.
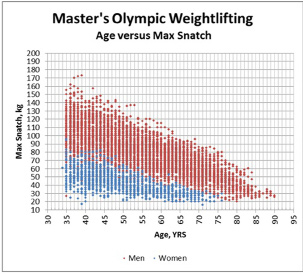
Men consistently lose about 1.4kg per year on their snatch scores between the ages of 35 and 75. After 75 years of age, this decline increases to 1.8kg/yr.
Women can expect to see their snatch scores decrease at a rate of 0.9kg/yr. It’s also fascinating, if you look closely at the performance of women between the age of 35 and 45 years old, you’ll see that there is an apparent plateau in the data. This suggests that the onset of the age-associated decline in performance for women is delayed for about 15 years relative to their male counterparts.

This information may be of interest to the weightlifting community, especially if you’re new to the sport or are getting older. I’m sure that there are no real revelations here. However, the variables are quantized a bit and we can confidently put boundaries around what we might be capable of as it relates to these most elegant movements that we call the Olympic lifts.
Once the decision is made to learn the lifts, some of the first questions that occur to the new athlete are, “How much should I be able to lift?” and “If I can snatch X, how much should I be able to clean & kerk?” and finally, “As a lifter no longer in my prime, how will I perform as I age?”
Additionally, one lifter may be larger or smaller than another. This is reflected in the separation by weight class. Furthermore, to split hairs, the weight classes are different between males and females. How does sex (the phenotype guys, not the act) affect the amount of weight we can lift?
These questions are not new and they’ve been treated elsewhere in the scientific literature. However, a “trust but verify” philosophy, using real data from real lifters in real competitions, might augment the knowledge base.
The data used for this article spans 10 years of competitions between 2001 and 2011, including the National Masters, Pan American Masters, World Masters and American Masters competitions. The purpose is tailored to the older, less experienced athlete. It includes over 8,000 event entries from over 3,870 lifters, including approximately 3,300 men and 570 women. The method largely applies linear regression analyses.
Before we dive into the details, a few definitions of statistical terms are in order. We’ll just deal with the basics:
Average: The average of a population or sample is defined as the sum of all measurements in the population or sample divided by the number of measurements. As a formula:
Median: The numerical value separating the higher half of a sample, a population, or a probability distribution, from the lower half… i.e., the “middle of the pack” value.
Percentile: the value of a variable below which a certain percent of all observations fall. For example, the 25th percentile is the value below which 25 percent of the all observations are found.
Now, let’s take the questions one at a time:
1. How much mass, in kilograms, should a Master’s Division Olympic weightlifting competitor be able to lift when performing the snatch and the clean & jerk?
Considering all participants, male and female, of all ages and weight classes that totaled, the overall average lift for the Snatch is 74kg while the overall average for the Clean & Jerk is 94kg.
Since the data is heavily weighted toward male participants by factor of about six (3,300 males vs. 570 females), intuitively one would deduce that the values represent men better than women. In fact they do, so we’ll differentiate between the sexes later.
But first, let’s consider the relationship between the Clean & Jerk and Snatch. In other words:
2. If a Master’s Division Weightlifter can snatch X, how much should he/she be able to Clean & Jerk?
By taking a simple ratio of the averages from the first question, we can see that
This ratio seems to be pretty consistent across most of the variables for which we are concerned. For most lifters no matter their age, or weight class this ratio doesn’t change too much, maybe a few percent one way or the other. But there is a slightly lower bias (two to three percent) toward our female competitors.
To illustrate this point, table 1 shows the average, median, 25th percentile and the 75th percentile values for the Snatch and Clean & Jerk as a function of sex.
Table 1
So for men, if you want to know a normal snatch weight, simply multiply your clean & jerk by 0.79, or conversely, if you want to know the normal clean & jerk, simply divide your snatch by 0.79. Women could use the same or slightly lower value of 0.77.
It should be noted that this relationship is not cast in stone. We are all individuals with different body types and abilities. However, deviations from this norm may point to deficiencies or weakness in the form or physiology of the lifter. An experienced coach may use this to his or her advantage, although, I imagine that a good coach wouldn’t need fancy math to assess an issue they could instantaneously figure out based on experiential knowledge.
The chart below shows the maximum clean & jerk values as a function of maximum snatch. The relationship for both men and women is very linear. The R2 values of over 0.9 indicate that this very tight relationship. In fact, we can say with 96 percent confidence that we can predict one variable knowing the other.
This relationship is also confirmed by the likes of Bob Takano ; who puts the relationship between 78 percent and 82 percent. It is also confirmed by others in various forums on the internet.
3. What about sex?
When it comes to the physics of lifting a heavy mass over our heads women are the weaker sex. There’s just no way around it. This certainly is not meant to be sexist, derogatory or mean-spirited in any sense. It’s just what the data says. The chart below is the distribution of total lift scores for men (red) and women (blue). In conjunction with the data from table 1, it can be seen that, on average, men can lift about twice as much mass as women.
This is not to say that some women can’t lift more than their male counterparts. That’s demonstrated by the overlap between the blue and red bars in the chart. As a matter of humility, the author would personally be an excellent female Masters competitor.
4. Body Mass?
Even newcomers to the sport learn quickly that as the mass of a weightlifter increases, so goes the maximal lifts attained. The next two charts are pretty busy, but they contain a wealth of information that should be useful to the average new guy/master’s level competitor.
These charts show the relationship between the body mass of males (red) and females (blue) and the snatch and clean & jerk, respectively. A note of caution: the data is somewhat confounded as it includes all age groups. More about age next.
Nevertheless, a lifter can gain insight relative to lifting potential by simply finding their body mass on the X-axes (horizontal) and looking up along the Y-axes (vertical) and seeing where the values intersect.
For instance, a male lifter weighing in at around 70kg can see that for the snatch, the data spans from a low of about 25 kg to a high of 124 kg. The middle of pack for this lifter is around 75kg. Similarly, the same lifter could expect to range between 35 and 150kg for their clean & jerk, with the middle of the pack being around 95kg. Just for fun, as a sanity check we can take the snatch/c&j ratio of 75kg/95kg = 78.9 percent and see that our ratio is consistent from above.
5. Age?
The final factor we’ll consider affecting the maximal lifts is our age. There’s no stopping time, so let’s march along with it and take what we can.
The next two graphs show the max snatch and max clean & jerk attempts for all competitors that totaled. They show the relationship between males (red) and females (blue) as a function of age in years for the snatch and clean & jerk, respectively.
Men consistently lose about 1.4kg per year on their snatch scores between the ages of 35 and 75. After 75 years of age, this decline increases to 1.8kg/yr.
Women can expect to see their snatch scores decrease at a rate of 0.9kg/yr. It’s also fascinating, if you look closely at the performance of women between the age of 35 and 45 years old, you’ll see that there is an apparent plateau in the data. This suggests that the onset of the age-associated decline in performance for women is delayed for about 15 years relative to their male counterparts.
This information may be of interest to the weightlifting community, especially if you’re new to the sport or are getting older. I’m sure that there are no real revelations here. However, the variables are quantized a bit and we can confidently put boundaries around what we might be capable of as it relates to these most elegant movements that we call the Olympic lifts.
|
Tom Brown III is a Senior Product R&D Engineer at a medical device manufacturer of video endoscopes. He completed his undergraduate degree in Electrical Engineering from the University of Hartford and graduate requirements in Materials Engineering from the University of Connecticut. For leisure, Tom battles gravity as a student of the snatch and clean & jerk, and succumbs to it by skydiving from perfectly good airplanes and B.A.S.E. jumping from perfectly good fixed objects. |
Search Articles
Article Categories
Sort by Author
Sort by Issue & Date
Article Categories
Sort by Author
Sort by Issue & Date